|
2.7 Bivariate Frequency Distribution
In table 7, we have classified students according to their marks in one subject. Suppose we have marks of a number of students in two subjects, say statistics and physics and we want to consider the variation of marks in both the subjects simultaneously. Then we have to prepare a table (known as a bivariate table) for the following data:
|
No. of students |
1 |
2 |
3 |
4 |
5 |
6 |
7 |
8 |
9 |
10 |
11 |
12 |
|
Marks in statistics |
60 |
56 |
42 |
33 |
40 |
13 |
27 |
12 |
19 |
50 |
23 |
16 |
|
Marks in physics |
50 |
45 |
53 |
54 |
49 |
23 |
50 |
24 |
31 |
41 |
47 |
20 |
|
|
|
|
|
|
|
|
|
|
|
|
|
|
|
No. of students |
13 |
14 |
15 |
|
|
|
|
|
|
|
|
|
|
Marks in statistics |
32 |
42 |
30 |
|
|
|
|
|
|
|
|
|
|
Marks in physics |
38 |
21 |
45 |
|
|
|
|
|
|
|
|
|
Table - 8
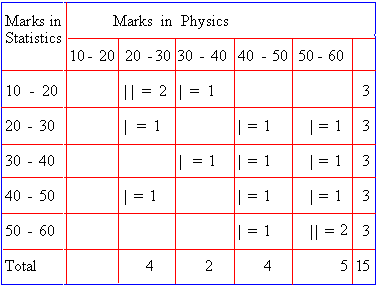
Procedure :
We have to consider a pair of data of observations.
We mark one stroke ( the tally mark )
for one pair.
Now consider the case of the 1st student.
Marks in statistics = 60
Marks in physics = 50
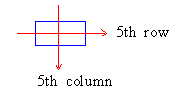
See the row along 50 - 60 ® 5th
row
and the column along 50 - 60 ¯
5th
column
Therefore the stroke is marked in the
cell ( box ) where the 5th row and the 5th column intersect
each other.
In this way we mark the strokes for 15
pairs of marks for 15 students and we get the table
- 8.
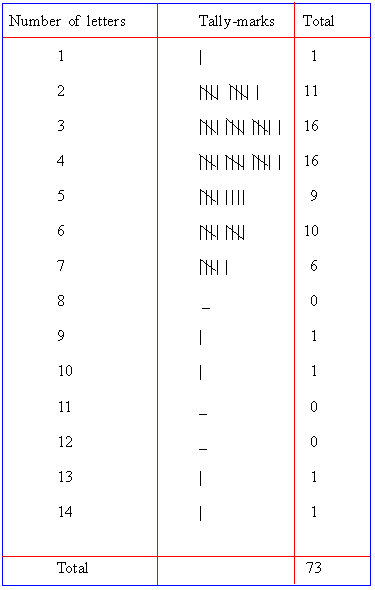
Example: Make a table showing the frequencies,
cumulative frequencies ( both less than and more than type ) for
the words having different numbers of letters in the following passage
(ignore the punctuation marks).
"In Asia the complications are likely to be greater still. There will be four major powers in the Asian balance: Russia, China, Japan and the United States. To some extent, this increases the chance that the forces will emerge sufficient to contain China and it may lead to a real reapproachment between Russia and the West. But who knows, with so many factors, what the pattern will be like, ten years from now ?"
From the Times
of India
Solution : We find that the smallest word
' a ' has one letter; and the longest word "re-approachment"
has 14 letters. We prepare a tally sheet by writing the number of
letters in the first column from 1 to 14. The table is as follows
:
Table - 9
|

