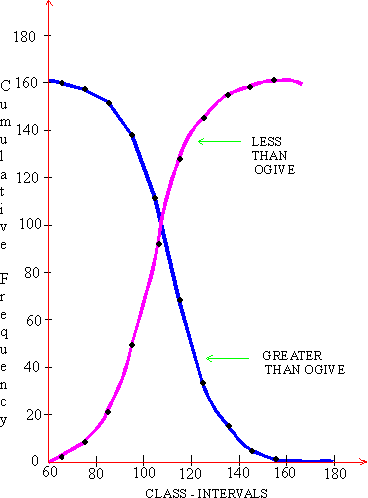
Uses :- Certain values like median, quartiles, deciles, quartile deviation, coefficient of skewness etc. can be located using ogives. it can be used to find the percentage of items having values less than or greater than certain value. Ogives are helpful in the comparison of the two distributions.
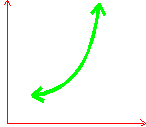
iii) J-Shaped Curve:- These curves are
so called, as they have the shape of a 'J' or a' U'. The distributions
are extremely asymmetrical.
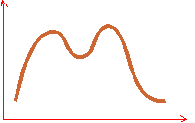
iv) Biomodal Curve:- Unlike a normal
curve ( symmetric distribution), a bimodal curve has two peaks or
humps.
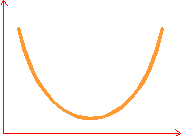
v) U-Shaped Curve:- When a distribution
is highly asymmetric we get this type of curve (U - type). U-Shaped
curve exhibits the maximum frequencies at the ends of the range
and the minimum towards the center.
|

