2.6 Cumulative Frequency
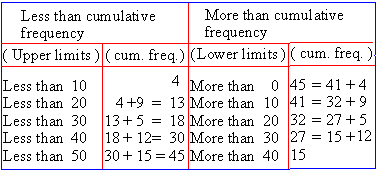
Many a times the frequencies of different classes are not given. Only their cumulative frequencies are given. The total frequency of all values less than or equal to the upper class boundary of a given class-interval is called the cumulative frequency up to and including that class interval. In this situation both the limits of a class-interval are not written; either lower or upper limit is written. These cumulative frequencies are called less than or more than cumulative frequencies. For example ,

Table - 5

Preparation Of Frequency Distribution
We shall now study how to classify the raw data in a tabular form. Consider the data collected by one of the surveyors, interviewing about 50 people. This is as follows :
Size of the shoes : 2, 5, 6, 8, 2, 5, 6, 7, 6, 8, 7, 4, 3, .. This is called the raw data. Here some values repeat themselves. For instance the size 5 is repeated 10 times in 50 people. We say that the value of 5 of the variate has the frequency of 10. Frequency means the number of times a value of the variate or an attribute, as the case may be, is repeated in the data. A table which shows each value of the characteristic with its corresponding frequency, is known as a Frequency Distribution. The procedure of preparing such a table is explained as below :
Discrete variate : Consider the raw data which gives the
size of shoes of 30 persons
2, 5, 6, 4, 5, 7, 4, 4, 6, 2
3, 5, 5, 4, 5, 6, 5, 4, 3, 2
4, 4, 5, 4, 5, 5, 3, 2, 4, 4
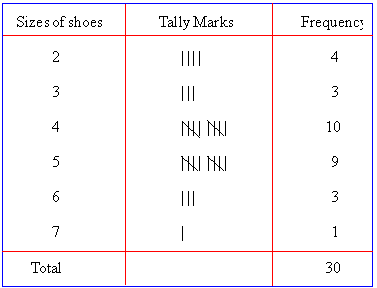
The least value is 2 and the highest is 7. All sizes are integers between 2 and 7 ( both inclusive ). We can prepare a frequency distribution table as follows :
Table - 6

In this example the size difference from 2 to 7 is very small. If the range of a variate is very large, it is inconvenient to prepare a frequency distribution for each value of the variate. In such a case we divide the variate into convenient groups and prepare a table showing the groups and their corresponding frequencies. Such a table is called a grouped frequency distribution.
|
Index
2.1 Introduction
2.2 Tabulation
2.3 Classification
2.4 Methods of classification
2.5 Relative frequency distribution
2.6 Cumulative frequency
2.7 Bivariate frequency distribution
Chapter 3
|