|
2.4 Methods Of Classification
The data is classified in the following ways :
- According to attributes or qualities this is divided into
two parts :
(A) Simple classification
(B) Multiple classification.
- According to variable or quantity or classification according
to class intervals. -
Qualitative Classification : When facts are grouped according
to the qualities (attributes) like religion, literacy, business
etc., the classification is called as qualitative classification.
(A) Simple Classification : It is also known as classification
according to Dichotomy. When data (facts) are divided into groups
according to their qualities, the classification is called as 'Simple
Classification'. Qualities are denoted by capital letters (A, B,
C, D ......) while the absence of these qualities are denoted by
lower case letters (a, b, c, d, .... etc.) For example ,

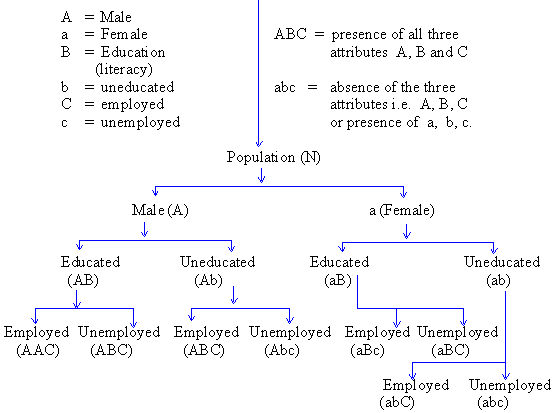
(B) Manifold or multiple classification : In this method data
is classified using one or more qualities. First, the data is divided
into two groups (classes) using one of the qualities. Then using
the remaining qualities, the data is divided into different subgroups.
For example, the population of a country is classified using three
attributes: sex, literacy and business as,

Click here to enlarge
Classification according to class intervals
or variables : The data which is expressed in numbers (quantitative
data), is classified according to class-intervals. While forming
class-intervals one should bear in mind that each and every item
must be covered. After finding the least value of an item and the
highest value of an item, classify these items into different class-intervals.
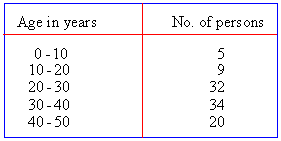
For example if in any data the age of 100 persons ranging from 2
years to 47 years, is given, then the classification of this data
can be done in this way:.
Table - 1

In deciding on the grouping of the data into classes, for the purpose of reducing it to a manageable form, we observe that the number of classes should not be too large. If it were so then the object of summarization would be defeated. The number of classes should also not be too small because then we will miss a great deal of detail available and get a distorted picture. As a rule one should have between 10 and 25 classes, the actual number depending on the total frequency. Further, classes should be exhaustive; they should not be overlapping, so that no observed value falls in more than one class. Apart from exceptions, all classes should have the same length.
|
Index
2.1 Introduction
2.2 Tabulation
2.3 Classification
2.4 Methods of classification
2.5 Relative frequency distribution
2.6 Cumulative frequency
2.7 Bivariate frequency distribution
Chapter 3
|