|
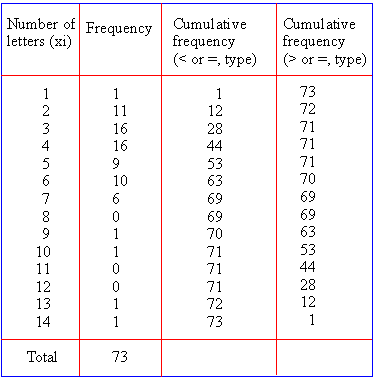
Table - 10

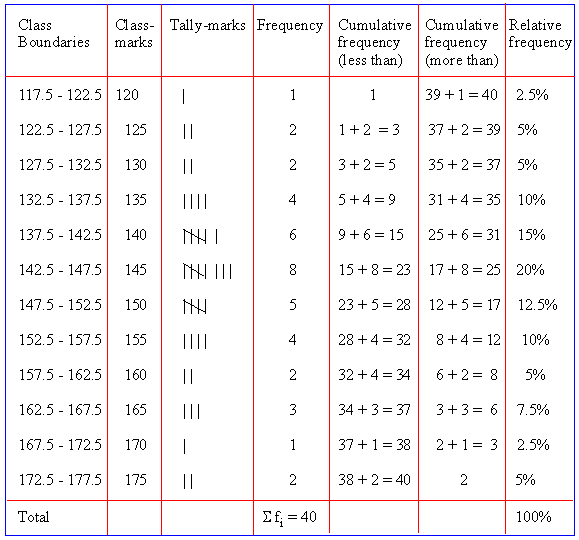
Example: The following gives the weights (to the nearest pounds)
of 40 students of the 7th grade. Construct a frequency distribution
table giving frequencies and cumulative frequencies of two types.
Tabulate the data into equal classes, the 1st class being 118 -
122. Also indicate the class boundaries and the class-marks.
144, 125, 149, 157, 132, 150, 164, 138,
146, 158, 140, 147, 168, 126, 138, 176,
136, 148, 142, 144, 163, 119, 154, 165,
146, 173, 161, 145, 135, 142, 142, 147,
135, 153, 140, 135, 150, 156, 128, 145
Solution : The successive classes are 118
- 122, 123 - 127, ....., 173 - 177. The lower and upper class boundaries
for the 1st class will be 117.5 and 122.5 and the class-mark will
be

The class-boundaries and the class-marks will go on increasing by 5.
Table - 11

Click here to enlarge
**********
|
Index
2.1 Introduction
2.2 Tabulation
2.3 Classification
2.4 Methods of classification
2.5 Relative frequency distribution
2.6 Cumulative frequency
2.7 Bivariate frequency distribution
Chapter 3
|