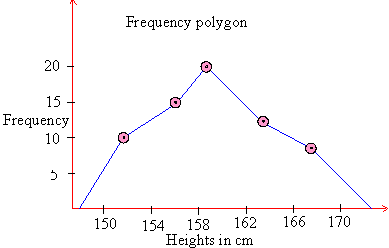
2) Frequency Polygon:- Here the frequencies
are plotted against the mid-points of the class-intervals and the
points thus obtained are joined by line segments.
Example
Height in cm. 150 - 154 154 - 158 158 - 162 162 - 166 166 - 170
No. of children 10 15 20 12 8
The polygon is closed at the base by extending it on both its sides ( ends ) to the midpoints of two hypothetical classes, at the extremes of the distribution, with zero frequencies.

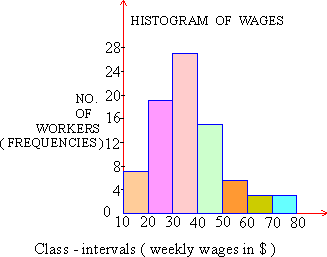
On comparing the Histogram and a frequency polygon, you will notice that, in frequency polygons the points replace the bars ( rectangles ). Also, when several distributions are to be compared on the same graph paper, frequency polygons are better than Histograms.
|