|
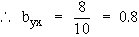
Therefore, 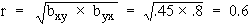
-
Standard deviation of y
\ Variance
of x i.e. s
x2 = 9 \
s x = 3
Now byx = 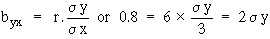
\ s
y = 0.4
Example From 10 observations of price x
and supply y of a commodity the results obtained S
x = 130, S y
= 220, S x2
= 2288, S xy = 3467
Compute the regression of y on x and interpret the result. Estimate the supply when the price of 16 units.
Solution: The equation of the line of regression of y
on x
y = a + b x
Also from normal equations
S y =
n a + b S
x and S
xy = a S
x + b S x2
we get
220 = 10 a + 130 b Þ (1)
3467 = 130 a + 2288 Þ (2)
Solving (1) and (2) as
2860 = 130 a + 1690 b
3467 = 130 a + 2288 b
On subtraction
\ 607
= 598 b \ b = 1.002
Putting b = 1.002 in 220 = 10 a + 130 b, we get a = 8.974.
Hence the 3 equation of the line of regression of y on x is
y = 8.974 + 1.002 x
|

