|
Example When flipped 1000 times, a coin
landed 515 times heads up. Does it support the hypothesis that the
coin is unbiased ?
Solution: The null hypothesis is that
the coin is unbiased.
In notations Ho : P = Po where Po = 0.5 and qo = 1 - Po = 0.5
Now the sample proportion is P' =  = 0.515 = 0.515
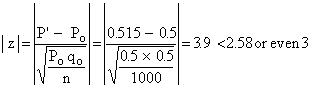
We then reject the null hypothesis. The coin is not unbiased.
Example While throwing 5 die 40 times, a
person got success 25 times - getting a 4 was called success. Can
we consider the difference between expected value and observed value
as being significantly different ?
Solution: If we carefully examine the data
then the hypothesis can be stated that the dice is unbiased.
In notation Ho : P = Po where 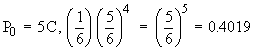
i.e. Ho : P = 0.4019 and Ha
: P ¹ 0.4019
The sample proportion P' =  = 0.625 = 0.625
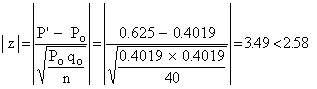
Hence the hypothesis Ho is to be rejected at 1% level of significance or we can say that the value obtained is highly significant. The given data do not support Ho. Thus the dice is not unbiased.
Example A patented medicine claimed that
it is effective in curing 90% of the patients suffering from malaria.
From a sample of 200 patients using this medicine, it was found
that only 170 were cured. Determine whether the claim is right or
wrong. (Take 1% level of significance).
Solution: The null hypothesis is that the
claim is quite right.
i.e. Ho : P = Po where Po = 90% = 0.9 and Ha : P ¹ 0.9.
Also qo = 0.1 and n = 200.
The sample proportion P' =  = 0.85 = 0.85
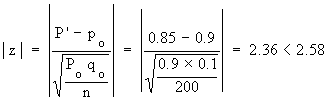
The null hypothesis Ho is quite right at 1% level of significance and that the claim is justified.
|

