|
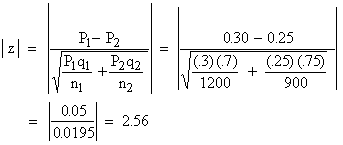
Example In two large populations there are
30% and 25% fair haired people respectively. Is the difference likely
to be hidden in sample of 1200 and 900 respectively from the two
populations ?
Solution:P1 = 30% = 0.30 and
P2 = 25% = 0.25 & q1 = 0.70 and q2
= 0.75 n1 = 1200 and n2 = 900.

Therefore, | z | > 1.96 ( i.e. at 5% level of significance ). Hence it is unlikely that the real difference will be hidden.
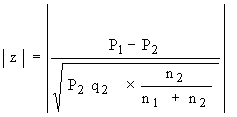
Note : At times you may be interested in the comparison of proportions of persons possessing an attribute in a sample with proportion given by the population. In that case use:

where P2 = Population proportion . q2 = 1 - P2
n1 = Number of observations in the sample
n1 + n2 = Size of population
n2 = (Size of population - n1 )
Example There are 1000 students in a college
out of 20000 students in the whole university. In a study 200 were
found smokers in the college and 1000 in the university. Is there
a significant difference between the proportion of smokers in the
college and in the university?
Solution: Ho : P1
= P2 i.e. there is no significant difference in the college
and university in case of proportion of smokers. Ha
: P1 ¹ P2.
Proportion of smokers in college P1 = 
Proportion of smokers in the university P2 =

q2 = 1 - P2 = 0.95
Also n1 = 1000 and n1 + n2 = 20000. \ n2 = 19000.


Since the value is highly significant, it could not have arisen due to sample fluctuations. Rejecting Ho we say that there is a significant difference between proportion of smokers in the college and the university.
|