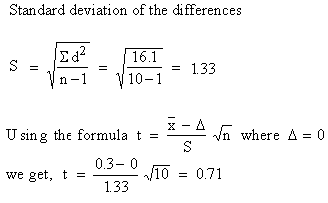
For n
= 10 - 9 = 9, t 0.05
= 2.57. Therefore , 0.71 < 2.57.
The null hypothesis is accepted i.e. the testing is reliable.
Example Boys from a certain class were
given a test in statistics. They were given a six months further
extra coaching and a second test of an equal level was held. Do
the marks give evidence that the students have benefitted by the
extra coaching ?
Boys 1 2 3 4 5 6 7 8 9 10 11
Marks (1st test) 23 20 19 21 18 20 18 18 23 16 19
Marks (2nd test)24 19 22 18 20 22 20 20 23 20 17
Solution: The null hypothesis Ho : m1
- m2
or Ho : m1
- m2
= 0 i.e. D = 0
alternative
hypothesis Ha
: m1
¹
m2
or Ha
: m1
- m2
¹ 0
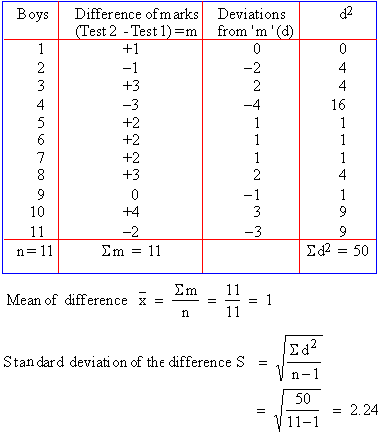

The number of degree of freedom is 11 - 1 = 10
t0.05,
n = 10 = 2.228.
Thus, 1.482 < 2.228 i.e. the calculated value of
t - it considerably less than the table value. Hence we accept null
hypothesis Ho, that the marks do not give any evidence that the
boys have been benefitted by the extra coaching.
Example A dietitian decided to try out a new type of
diet program on 10 boys. Before applying this program, he recorded
their weights. Three months later, he recorded their weights again.
The weight would have grown by an average of 6 kgs. during this
period even without this special diet program. Did this special
diet program help ? Use 0.05 level of significance.
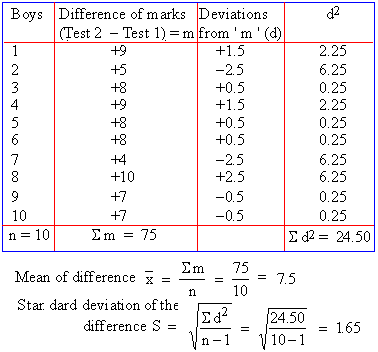
Boys 1 2 3 4 5 6 7 8 9 10
Before weight 36 32 31 36 23 28 25 26 35 28
After weight 45 37 39 45 31 34 29 36 42 35
Solution: The null hypothesis Ho
: m1
¹
m2
or Ho : m1
- m2
¹ 0
or
more clearly Ho : m1
- m2
i.e. D £ 6
alternative
hypothesis Ha
: D > 6
The degree of
freedom n (df) = 10 - 1
= 9. The test is one-tailed because we are asked only whether the
new diet program increases the weight and not whether it reduces
it.
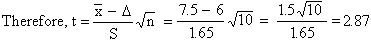
Now t0.05,
n
= 9 = 2.26 ( i,e. t0.025,
n = 9 = 2.25 for one tailed
test) Because 2.87 > 2.26. The null hypothesis can be rejected.
Thus the test has provided evidence that the new diet program caused
the weight increase in boys. Though the amount of actual increase
was not large ( 1.6 kgs over normal weight) but is was statistically
significant.
|

