|
Thus in 2 ´
2 table df = ( 2 - 1 ) ( 2 - 1 ) = 1
3 ´
3 table df = (3 - 1 ) ( 3 - 1 ) = 4
4
´ 4 table df = ( 4 -
1 ) ( 4 - 1 ) = 9 etc.
If the data is not in the form of contingency tables
but as a series of individual observations or discrete or continuous
series then it is calculated by n
= n - 1 where n is the number of frequencies or values of number
of independent individuals.

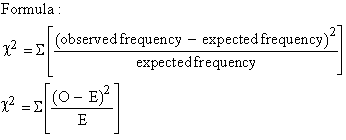
where O = observed frequency and E = expected frequency.
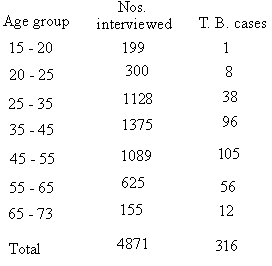
Example The following table shows the
age groups of people interviewed according to their age-group and
the number in each group estimated to have T. B.

Do these figures justify the hypothesis that T.
B. is equally popular in all age groups ?
Solution: If T.B. equally popular in all groups
then in each age group
 . .
O n this basis the observed and expected frequencies would be as
| Age group |
Observed Cases |
Expected cases |
| |
|
|
| 15 - 20 |
1 |
13 |
|
20 - 25 |
8 |
19.5 |
|
25 - 35 |
38 |
73 |
|
35 - 45 |
96 |
89 |
|
45 - 55 |
105 |
71 |
|
55 - 65 |
56 |
40.5 |
|
65 - 75 |
12 |
10 |

Also n (df ) = ( c - 1 ) ( n - 1 ) = ( 7 - 1 ) ( 2 - 1 ) = 6
From the c2 - table, c2 0.05, n = 6 = 12.59
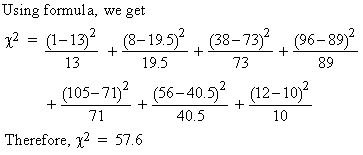
Since 57.6 > 12.59 at 0.05 level of significance
for 6 degree of freedom, the difference is significant and the hypothesis
is not justified.
Example 12 die were thrown 4096 times and a throw of
6 was reckoned as a success. The observed frequencies were as given
below :
Number of
successes |
0 |
1 |
2 |
3 |
4 |
5 |
6 |
7 |
and over |
Total |
|
|
|
|
|
|
|
|
|
|
|
|
|
Frequencies |
447 |
1145 |
1181 |
796 |
380 |
115 |
24 |
8 |
- |
4096 |
Find the value of c2 on the hypothesis that the dice were unbiased and hence show that the data is consistent with the hypothesis so far as the c2 test is concerned.
Solution: On the hypothesis of unbiased
dice the theoretical frequencies in 4096 throws are the terms in
the Binomial expansion of 4096 ( 5/6 + 1/6 )2 and are given below
:
Number of
successes |
0 |
1 |
2 |
3 |
4 |
5 |
6 |
7 |
and over |
Total |
|
|
Theoretical |
|
|
|
|
|
|
|
|
|
|
|
Frequencies |
459 |
1102 |
1212 |
808 |
364 |
116 |
27 |
8 |
- |
4096 |
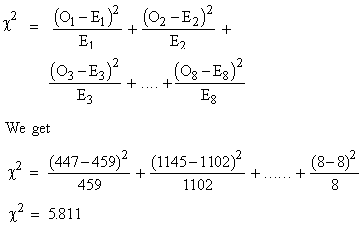
Using the formula :

The number of classes is 8 but the total of the observed and theoretical frequencies agree. Therefore n (df) = 8 - 1 = 7. From the table c20.05, n = 7 = 14.07 i.e. the calculated value of c2 is not significant and thus the observed frequency distribution is consistent with the hypothesis.
Example Two hundreds digits were chosen at random from
a set of tables. The frequencies of the digits are as below :
|