|
Graphs of the Hyperbolic functions
The values of sin hx, cos hx, tan hx for x = - ¥ , 0 , + ¥
are obtained from the definitions and tabulated as :-
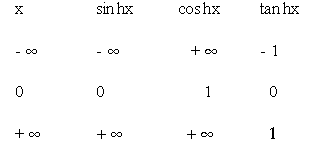
Since ex, e-x are always +ve (or zero), it will be seen that tan
hx is always < 1, its value must lie between ± 1
From the definition it is clear that sin hx < cos hx
Hence the curve y = sin hx,
y = cos hx, y = tan hx, have forms 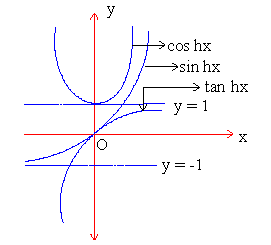
shown in the adjoining fig.
Equations involving hyperbolic functions
can be solved approximately by graphical methods.
Use of tables of hyperbolic functions for
plotting their curves is always advisable.
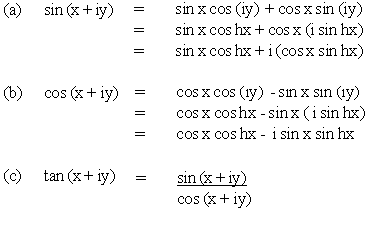
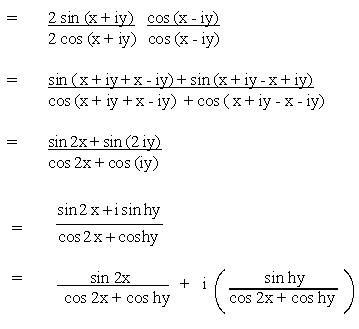
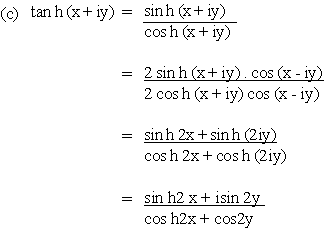
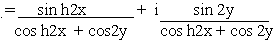
Example 1 Separate the real and imaginary parts of :
(a) sin (x + iy) (b) cos (x + iy) (c) tan (x + iy)
Solution :
Example 2
Separate the real and imaginary parts of (a) sin h (x + iy) (b)
cos h (x + iy) (c) tan h (x + iy)
Solution
[next page]
|
