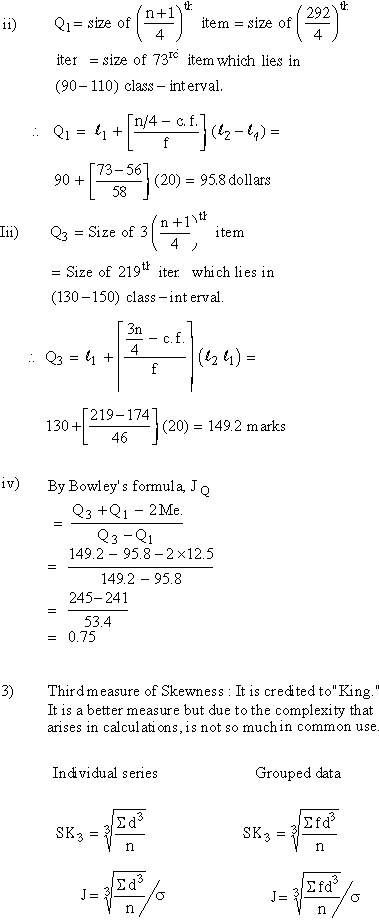
|
Note: You will always find the different values of J when calculated by Karl Pearson’s and Bowley’s formula. But the value of J by Bowley’s formula always lies with ± 1.
Example The following table gives the frequency distribution of 291 workers of a factory according to their average monthly income in 1945 - 55.
|
Income group ($) : |
No.of workers : |
|
Below 50 |
1 |
|
50-70 |
16 |
|
70-90 |
39 |
|
90-110 |
58 |
|
110-130 |
60 |
|
130-150 |
46 |
|
150-170 |
22 |
|
170-190 |
15 |
|
190-210 |
15 |
|
210-230 |
9 |
|
230 & above |
10 |
Solution:
|
Income group |
f |
c.f. |
|
Below 50 |
1 |
1 |
|
50 - 70 |
16 |
17 |
|
70 - 90 |
39 |
56 |
|
90 - 110 |
58 |
114 |
|
110 - 130 |
60 |
174 |
|
130 - 150 |
46 |
220 |
|
150 - 170 |
22 |
242 |
|
170 - 190 |
15 |
257 |
|
190 - 210 |
15 |
252 |
|
210 - 230 |
9 |
281 |
|
230 & above |
10 |
291 |
|
n = S f = 291 |
Calculations :
1) Median = Size of  item item
= Size of  item
item
= Size of 146th item which lies in (100-130) class interval.
\ Me = 
=
=
= 

[next page]
|
Index
5.1 Introduction
5.2 Methods of computing dispersion
5.3 Range
5.4 Mean Deviation
5.5 Variance
5.6 Coefficient of Variation
5.7 Percentile
5.8 Quartiles and interquartile range
5.9 Skewness moments and Kurtosis
5.10 Kurtosis
Chapter 6
|