|
Method of Drawing a graph of y = a sin (bx + c) and y = a cos (bx + c)
i) For drawing the graph of y = a sin (bx + c) .........(1)
Transfer the origin to 0'[-c/b, 0] without changing the direction of the coordinate axes so
that the equation (1) reduces to the form y = a sin (bx) ..........(2)
It is easy to plot the graph of (2) in the new system so that the same graph represents the graph of (1) in the original system.
ii) For the graph of y = a cos (bx + c) ..........(1)
Transfer the origin to 0'[-c / b + c] keeping the same directions of the coordinates axes.
Then equation (1) reduces to
y = a cos (bx) ..........(2)
The graph of (2) in the new system represents the graph of (1) in the original system.
Maximum and Minimum values of y = d + a sin bx and d + a cos bx
Formulas
-
Maximum value (M) = d + a, it occurs when sin x and cos x are 1.
-
Minimum value (m) = d - a, it occurs when both sin x and cos x are -1.
EXAMPLE 1
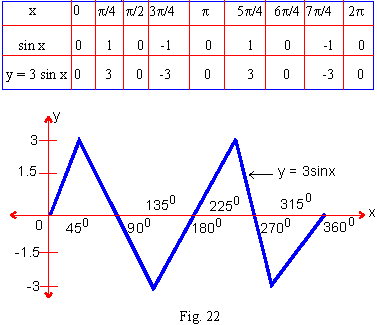
Draw the graph of y = 3 sin 2x. Find its maximum and minimum value.
Solution : The values of x and y are tabulated as

From the graph it is seen that:
i) y = 3 sin 2x has period T = p
ii) Its maximum value is M = d + a = 0 + 3 = 3 and Minimum value m = d - a = 0 - 3 = -3
iii) The maximum value is attained at x =
450 and 2250 and minimum value at x = 1350 and
3150 which are known as maxima and minima of y = 3 sin x.
|