8.12 Sampling of Attributes
Characteristics like religion, language, locality etc. cannot be measured in numbers as they are attributes. We can only say whether a particular attribute is present or absent in an individual. The sampling of attributes means drawing a sample from the population, of which every member possesses a particular attribute or does not have it. In many cases, we are interested in knowing how many in the population possess the attribute. For instance, Brooke wants to know how many from his area are smokers i.e. he is interested in the number or proportion of smokers in his area. Now we shall see how to test a hypothesis about the number or proportion of the individuals of the population possessing an attribute.
Testing the hypothesis that population proportion p = Po
In notations : Ho : population proportion = Po
Now P' = sample proportion is normally distributed with mean Po and standard deviation 
Hence z = 
If | z | > 1.96 a rare event has taken place.
If P ( | z | > 1.96 ) = 0.05 we reject the hypothesis
= Po at 5% level of significance. If | z | > 1.96 a usual event has happened and accept the hypothesis that
P = Po at 5% level of significance. If | z | > 2.58 a rare (unusual) event has taken place. Now P ( | z | > 2.58 ) = 0.01. We then reject the hypothesis P = Po at 1% level of significance.
If | z | > 2.58, an unusual event occurred and we accept the hypothesis at 1% level of significance.
Example A sample of 600 persons selected at random from a large city shows that there are 53% smokers. Is there any reason to doubt the hypothesis that smokers and non-smokers are equal in number in the city ?
Solution: The null hypothesis is that the
smokers and non smokers are equal in numbers.
Ho : P = Po and Ha : P ¹ Po
where Po = 0.5 Þ qo = 1 - Po = 0.5
Also the sample proportion is P' = 53% = 0.53 and n = 600.
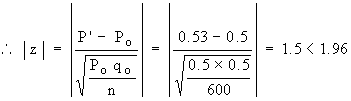
Hence the hypothesis Ho is accepted at 5% level of significance. i.e. we can undoubtedly say that both smokers and non-smokers are equal in numbers in that city.
|

