8.18 Student's t-distribution
This concept has been introduced by W. S. Gosset (1876 - 1937). He adopted the pen name "student." Therefore, the distribution is known as 'studentís t-distribution'.
It is used to establish confidence limits and test the hypothesis when the population variance is not known and sample size is small ( < 30 ).
If a random sample x1,
x2, .......,
xn of n values be drawn from a normal population with
mean m and standard deviation
s then the mean of sample

Estimate of the variance : Let s2
be the estimate of the variance of the sample then s2
given by
 ( n
- 1 ) as denominator in place 'n'. ( n
- 1 ) as denominator in place 'n'.
( I ) The statistic 't' is defined as
t = 
Where x = sample mean, m
= actual or hypotheticalmean of population, n = sample
size, s = standard deviation of sample.
Where s = 
Note: 't' is distributed as the student distribution
with
( n - 1 ) degree of freedom (df ).
(II)1) The variable 't' distribution ranges
from minus infinity to plus infinity.
2) Like standard normal distribution, it is also symmetrical and has mean zero
3) s2
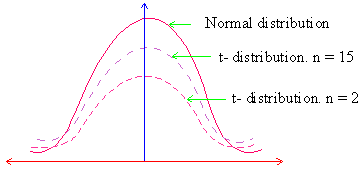
of t-distribution is greater than 1, but becomes 1 as 'df'
increases and thus the sample size becomes large. Thus
the variance of t-distribution approaches the variance of the normal distribution as the sample size increases
for n
( df ) = •, the t-distribution
matches with
the normal distribution. (observe the adjoining figure).

Also
note that the t-distribution is lower at the mean and higher
at the tails than the normal distribution. The t-distribution
has proportionally greater area at its tails than
the normal distribution.
(III) 1) If | t | exceeds t0.05 then
difference between x and m is
significant at 0.05 level of significance.
2) If | t | exceeds t0.01, then difference
is said to highly significant at 0.01 level of significance.
3) If | t | <
t0.05 we conclude that the difference between  and m is not significant and the sample might have been drawn from
a population with mean =
m i.e. the data is consistent
with the hypothesis.
(IV)Fiducial limits of population mean

Example A random sample of 16 values
from a normal population is found to leave a mean of 41.5 and standard
deviation of 2.795. On this basis is there any reason to reject
the hypothesis that the population mean m
= 43? Also find the confidence limits for m.
Solution: Here n = 16 - 1 = 15,  = 41.5 , s
= 2.795 and m = 43.
Now 
From the t-table for 15 degree
of freedom, the probability of t being 0.05, the value of t = 2.13.
Since 2.078 < 2.13. The difference between  and m is not significant.
Now, null hypothesis
: Ho : m = 43
and
Alternative
hypothesis : Ha
: m
Ļ 43.
|