|
Example Two samples of 100 electric
bulbs each has a means 1500 and 1550, standard deviations are 50
and 60. Can it be concluded that two brands differ significantly
in equality at 1% level of significance?
Solution: Ho : m1
- m2 i.e. there is no significant
difference in the mean life of two brands of bulbs. We have  = 1500,
  = 1500, s1 = 50, s2
= 60, n1 = 100 and n2 = 100.
= 1500, s1 = 50, s2
= 60, n1 = 100 and n2 = 100.
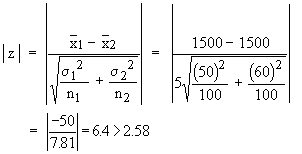
Therefore, the null hypothesis Ho is rejected. Hence there is a significant difference in the mean life of the two brands of bulbs.
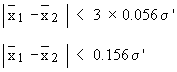
Example Two populations have their means
equal but the standard deviation of one is twice of the other. If
samples of size 2000 are drawn from each population, show that the
difference between the means will almost not exceed 0.15 s'
where s' is the smaller S.D.
Solution: We have s1 = s',
s2 = 2s',
n1 = 2000, n2 = 2000
Therefore
S = 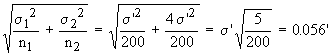
Now
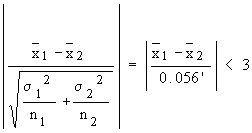
i.e.
Example The data of a certain trace element
in blood is as under :
| |
Sample - I |
Sample - II |
|
Mean |
28 ppm |
32 ppm |
|
S. D. |
14 ppm |
10 ppm |
|
Size |
75 male |
60 female |
What is the likelihood that the population means of the concentration of the elements are the same for male and female (at 95% confidence level)?
Solution: The null hypothesis is Ho
: m1 - m2
and the alternative hypothesis Ha : m1
¹ m2.
We have  = 28, = 32, s1 = 14, s2 = 10, n1 = 75 and = 28, = 32, s1 = 14, s2 = 10, n1 = 75 and
n2 = 60.
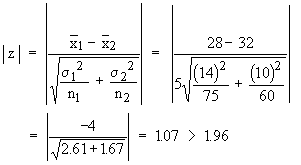
Thus Ho is accepted i.e. the population means of the concentrations of the elements are the same for both male and female.
Example In a certain school there are 6th
graders and 7th graders. The average weight of students in a sample
of 250 in 6th graders was found to be 120 lbs with s.d. of 12 lbs.
While the corresponding figures in a sample of 400 students from
7th graders were 124 lbs and 141 lbs. Is the difference significant
? Also find 99% confidence limits for the difference in the average
weights of students in the two graders.
Solution: We have Ho : m1
- m2 and Ha : m1
¹ m2.
 = 120, s1 = 12, n1 = 250 ® For 6th graders = 120, s1 = 12, n1 = 250 ® For 6th graders
=124, s2 = 14, n2 = 400 ® For 7th graders
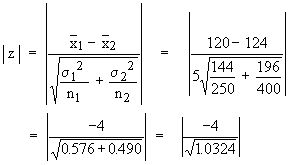
| z | = 3.87 > 3
Hence, the difference between two samples is significant as we have rejected Ho.
Now 99% confidence limits are given by ( x1 - x2) ± 2.585
= ( 4 ) ± 2.58 ´ 1.0324
= 4 ± 2.66 which are ( 1.34, 6.66 ).
|

