|
Example A random sample of 400 workers
from the Lorson and Lorson was drawn for estimating the average
salary. The sample mean was $ 800 and S.D. was $100. Find 95% confidence
interval.
Solution: 95% confidence limits are  ± 1.96 S.E. ± 1.96 S.E.
Now S.E. = 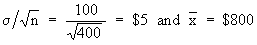
Therefore we have ± 1.96 S. E. = 800 ± 1.96 (5)
i.e. 800 - 1.96(5) = $ 809 + 0
800 + 1.96(5) = $ 890
Population proportion: For population proportion
the limits are
1) P' ± 1.96 S.E. at 95% confidence level.
2) P' ± 2.58 S.E. at 99% confidence level.
3) P' ± 3 S.E. at 99.73% confidence level.
When, instead of proportion, if we required the number in the size N of the population, from the sample of size 'n' the intervals are just multiplied by N.
i.e. N ( P' ± 1.96 S.E. ) for 9.5% confidence level etc.
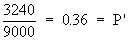
Example A dice is thrown 9000 times and
a throw of 5 or 6 considered success, was obtained 3240 times. Show
that the dice is not unbiased and find the limits between which
the probability of a throw of 5 or 6 lies.
Solution: The null hypothesis is that the
dice is not unbiased.
In notation : Ho : Po = 0.5 i.e. Ha : Po ¹ 0.5
Po = 0.5 then qo = 0.5, n = 9000
Also, sample proportion =
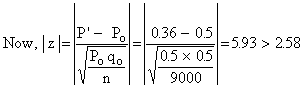
Thus Ho is rejected i.e. the dice is not unbiased. The 99.73% confidence limits are P' ± 3 S.E. where P' = 0.36 and
S.E. 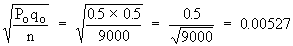
Therefore, P' ± 3 S.E. = 0.36 ± 0.00527.
i.e. 0.36 - 0.00527 = 0.35473 to
0.36 + 0.00527 = 0.36527
|

